Population growth
Population growth refers to change in the size of a population—which can be either positive or negative—over time, depending on the balance of births and deaths. If there are many deaths, the world's population will grow very slowly or can even decline. Population growth is measured in both absolute and relative terms. Absolute growth is the difference in numbers between a population over time; for example, in 1950 the world's population was 4 billion, and in 2000 it was 6 billion, a growth of 2 billion. Relative growth is usually expressed as a rate or a percentage; for example, in 2000 the rate of global population growth was 1.4 percent (or 14 per 1,000). For every 1,000 people in the world, 14 more are being added per year.For the world as a whole, population grows to the extent that the number or rate of births exceeds the number or rate of deaths. The difference between these numbers (or rates) is termed "natural increase" (or "natural decrease" if deaths exceed births). For example, in 2000 there were 22 births per 1,000 population (the number of births per 1,000 population is termed the "crude birth rate") and 9 deaths per 1,000 population (the "crude death rate"). This difference accounts for the 2000 population growth rate of 14 per 1,000, which is also the rate of natural increase. In absolute numbers, this means that approximately 78 million people—or about the population of the Philippines—are added to the world each year. For countries, regions, states, and so on, population growth results from a combination of natural increase and migration flows. The rate of natural increase is equivalent to the rate of population growth only for the world as a whole and for any smaller geographical units that experience no migration.
Populations can grow at an exponential rate, just as compound interest accumulates in a bank account. One way to assess the growth potential of a population is to calculate its doubling time—the number of years it will take for a population to double in size, assuming the current rate of population growth remains unchanged. This is done by applying the "rule of seventy"; that is, seventy divided by the current population growth rate (in percent per year). The 1.4 percent global population growth rate in 2000 translates into a doubling time (if the growth rate remains constant) of fifty-one years.
History of Global Population Growth
As can be seen in Figure 1, the world's population grew very slowly until about 1750. There was a long period of stationary growth (no growth) until 1000 B.C.E. , when the world's population was approximately 300 million; this was followed by a period of slow growth from 1000 B.C.E. to approximately 1750, at which time global population was an estimated 800 million. Until this time, the world's population was kept in check by high death rates, which were due to the combined effects of plagues, famines, unsanitary living conditions, and general poverty. After 1750, the world's population grew substantially; by 1950 it had tripled to around 2.5 billion. In this 200-year period, the doubling time was 122 years. Growth from 1950 to 1985 was even more dramatic; by 1985, the human population was 5 billion. World population had doubled in thirty-five years. By 2000 global population was 6 billion and is projected to be 9 billion in 2050.Population growth did not become exponential until around 1750. Before that, high mortality counterbalanced the high fertility needed by agrarian parents. Death rates were high and life expectancy was low; life expectancy at birth was in the range of twenty to forty years (most likely around thirty years) until the middle of the eighteenth century. This high mortality was a function of several factors, including poor nutrition, which led directly to deaths through starvation and indirectly through increasing susceptibility to disease; epidemics; and, quite possibly, infanticide and geronticide, especially during times of food shortage.
Starting in the middle of the eighteenth century, the mortality rate began to decline in the West, the first place in the world where the natural balance between births and deaths was altered by humans. This decline in deaths occurred not because of major medical breakthroughs (e.g., penicillin was first used only in the 1940s) but rather because of improvements in food availability, housing, water cleanliness, personal hygiene, and public sanitation. Later, in the twentieth century, medical advances, particularly vaccinations against infectious diseases, accelerated mortality decline.
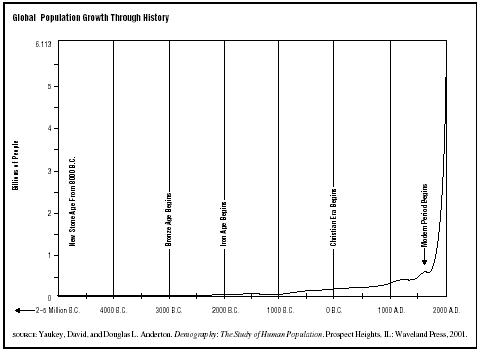
FIGURE 1
As a result, the world witnessed unprecedented rapid population growth between 1950 and 1985, owing, in large part, to third world increases.
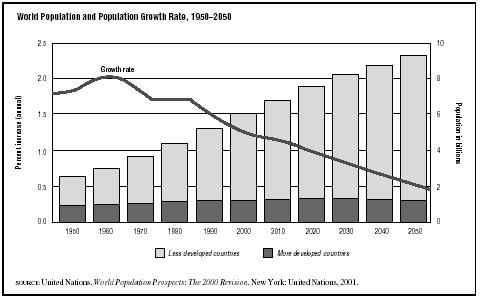
FIGURE 2
From Wikipedia, the free encyclopedia

In demography, population growth is used informally for the more specific term population growth rate (see below), and is often used to refer specifically to the growth of the human population of the world.
Simple models of population growth include the Malthusian Growth Model and the logistic model.
Human population growth rate


The actual annual growth in the number of humans fell from its peak of 88.0 million in 1989, to a low of 73.9 million in 2003, after which it rose again to 75.2 million in 2006. Since then, annual growth has declined. In 2009 the human population increased by 74.6 million, and it is projected to fall steadily to about 41 million per annum in 2050, at which time the population will have increased to about 9.2 billion.[8] Each region of the globe has seen great reductions in growth rate in recent decades, though growth rates remain above 2% in some countries of the Middle East and Sub-Saharan Africa, and also in South Asia, Southeast Asia, and Latin America.[9]
Some countries experience negative population growth, especially in Eastern Europe (mainly due to low fertility rates and emigration). In Southern Africa, growth is slowing due to the high number of HIV-related deaths. Some Western Europe countries might also encounter negative population growth.[10] Japan's population began decreasing in 2005 [11]
Excessive growth and decline
Main articles: Overpopulation and population declinePopulation exceeding the carrying capacity of an area or environment is called overpopulation. It may be caused by growth in population or by reduction in capacity. Spikes in human population can cause problems such as pollution and traffic congestion, these might be resolved or worsened by technological and economic changes. Conversely, such areas may be considered "underpopulated" if the population is not large enough to maintain an economic system (see population decline). Between these two extremes sits the notion of the optimum population.
http://en.wikipedia.org/wiki/Population_growth
Philippines Population
| Year | Population | Rank | Percent Change | Date of Information |
|---|---|---|---|---|
| 2003 | 84,619,974 | 12 | July 2003 est. | |
| 2004 | 87,857,473 | 12 | 3.83 % | July 2005 est. |
| 2005 | 87,857,473 | 12 | 0.00 % | July 2005 est. |
| 2006 | 89,468,677 | 12 | 1.83 % | July 2006 est. |
| 2007 | 91,077,287 | 12 | 1.80 % | July 2007 est. |
| 2008 | 96,061,680 | 12 | 5.47 % | July 2008 est. |
| 2009 | 97,976,603 | 12 | 1.99 % | July 2009 est. |
Family planning
From Wikipedia, the free encyclopedia
is the planning of when to have children,and the use of birth control and other techniques to implement such plans. Other techniques commonly used include sexuality education, prevention and management of sexually transmitted infections, pre-conception counseling and management, and infertility management.

Family planning services are defined as "educational, comprehensive medical or social activities which enable individuals, including minors, to determine freely the number and spacing of their children and to select the means by which this may be achieved.


Unemployment
Unemployment occurs when a person is available and willing to work but currently without work.[1] The prevalence of unemployment is usually measured using the unemployment rate, which is defined as the percentage of those in the labor force who are unemployed. The unemployment rate is also used in economic studies and economic indices such as the United States' Conference Board's Index of Leading Indicators as a measure of the state of macroeconomics.Mainstream economics believes in the main that unemployment is inevitable, and a necessary evil to prevent inflation; this is disputed by some schools of heterodox economics. The causes of unemployment are disputed. Keynesian economics emphasizes unemployment resulting from insufficient effective demand for goods and services in the economy (cyclical unemployment). Others point to structural problems and inefficiencies inherent in labour markets; structural unemployment involves mismatches between demand and supply of laborers with the necessary skillset, sometimes induced by disruptive technologies or globalisation. Classical or neoclassical economics tends to reject these explanations, and focuses more on rigidities imposed on the labor market from the outside, such as unionization, minimum wage laws, taxes, and other regulations that may discourage the hiring of workers (classical unemployment). Yet others see unemployment as largely due to voluntary choices by the unemployed and the time it takes to find a new job (frictional unemployment). Behavioral economics highlights phenomena such as sticky wages and efficiency wages which may lead to unemployment.
There is also disagreement on how exactly to measure unemployment. Different countries experience different levels of unemployment; traditionally, the United States experiences lower unemployment levels than countries in the European Union, although there is variant there, with countries like the UK and Denmark outperforming Italy and France and it also changes over time (e.g. the Great Depression) throughout
Involuntary unemployment
In The General Theory, Keynes argued that neo-classical economic theory did not apply during recessions because of oversaving and private investor timidity. In consequence, people could be thrown out of work involuntarily and not be able to find acceptable new employment.This conflict between the neoclassical and Keynesian theories has had strong influence on government policy. The tendency for government is to curtail and eliminate unemployment through increases in benefits and government jobs, and to encourage the job-seeker to both consider new careers and relocation to another city.
Involuntary unemployment does not exist in agrarian societies nor is it formally recognized to exist in underdeveloped but urban societies, such as the mega-cities of Africa and of India/Pakistan. In such societies, a suddenly unemployed person must meet their survival needs either by getting a new job at any price, becoming an entrepreneur, or joining the underground economy of the hustler.[3]
Involuntary unemployment is discussed from the narrative standpoint in stories by Ehrenreich, the narrative sociology of Bourdieu, and novels of social suffering such as John Steinbeck's The Grapes of Wrath.
Solutions
Societies try a number of different measures to get as many people as possible into work, and various societies have experienced close to full employment for extended periods, particularly during the Post-World War II economic expansion. The United Kingdom in the 1950s and 60s averaged 1.6% unemployment,[4] while in Australia the 1945 White Paper on Full Employment in Australia established a government policy of full employment, which policy lasted until the 1970s.Mainstream economics since the 1970s believes however that attempts to reduce the level of unemployment beyond the Natural rate of unemployment will fail, resulting only in less output and more inflation.
] Demand side

Government-funded employment is not widely advocated as a solution to unemployment, except in times of crisis; this is attributed to the perceived superiority of private sector employment over public sector employment.[5]
According to classical economic theory, markets reach equilibrium where supply equals demand; everyone who wants to sell at the market price can. Those who do not want to sell at this price do not; in the labour market this is classical unemployment. Increases in the demand for labour will move the economy along the demand curve, increasing wages and employment. The demand for labour in an economy is derived from the demand for goods and services. As such, if the demand for goods and services in the economy increases, the demand for labour will increase, increasing employment and wages. Monetary policy and fiscal policy can both be used to increase short-term growth in the economy, increasing the demand for labour and decreasing unemployment.
Supply side
However, the labour market is not efficient: it does not clear. Minimum wages and union activity keep wages from falling, which means too many people want to sell their labour at the going price but cannot. Supply-side policies can solve this by making the labour market more flexible. These include removing the minimum wage and reducing the power of unions. Other supply side policies include education to make workers more attractive to employers.Supply side reforms also increase long-term growth. This increased supply of goods and services requires more workers, increasing employment. It is argued that supply side policies, which include cutting taxes on businesses and reducing regulation, create jobs and reduce unemployment.
Types of unemployment
Economists distinguish between various types of unemployment, including cyclical unemployment, frictional unemployment, structural unemployment and classical unemployment.[6] Some additional types of unemployment that are occasionally mentioned are seasonal unemployment, hardcore unemployment, and hidden unemployment. Real-world unemployment may combine different types. The magnitude of each of these is difficult to measure, partly because they overlap.Though there have been several definitions of voluntary and involuntary unemployment in the economics literature, a simple distinction is often applied. Voluntary unemployment is attributed to the individual's decisions, whereas involuntary unemployment exists because of the socio-economic environment (including the market structure, government intervention, and the level of aggregate demand) in which individuals operate. In these terms, much or most of frictional unemployment is voluntary, since it reflects individual search behavior.
On the other hand, cyclical unemployment, structural unemployment, and classical unemployment, are largely involuntary in nature. However, the existence of structural unemployment may reflect choices made by the unemployed in the past, while classical (natural) unemployment may result from the legislative and economic choices made by labor unions and/or political parties. So in practice, the distinction between voluntary and involuntary unemployment is hard to draw. The clearest cases of involuntary unemployment are those where there are fewer job vacancies than unemployed workers even when wages are allowed to adjust, so that even if all vacancies were to be filled, there would be unemployed workers. This is the case of cyclical unemployment, for which macroeconomic forces lead to microeconomic unemployment.
Frictional unemployment
| | The following text needs to be harmonized with text in Frictional unemployment. |
Frictional unemployment is always present in an economy, so the level of involuntary unemployment is properly the unemployment rate minus the rate of frictional unemployment, which means that increases or decreases in unemployment are normally under-represented in the simple statistics.[7]
Classical unemployment
Classical or real-wage unemployment occurs when real wages for a job are set above the market-clearing level, causing the number of job-seekers to exceed the number of vacancies.Libertarian economists like F.A. Hayek argued that unemployment increases the more the government intervenes into the economy to try to improve the conditions of those with jobs. For example, minimum wage laws raise the cost of labourers with few skills to above the market equilibrium, resulting in people who wish to work at the going rate but cannot as wage enforced is greater than their value as workers becoming unemployed.[8][9] They believed that laws restricting layoffs made businesses less likely to hire in the first place, as hiring becomes more risky, leaving many young people unemployed and unable to find work.[9]
Some, such as Murray Rothbard,[10] suggest that even social taboos can prevent wages from falling to the market clearing level.
Some economists theorize that this type of unemployment can be reduced by increasing the flexibility of wages (e.g., abolishing minimum wages or employee protection), to make the labor market more like a financial market.[citation needed]
Cyclical or Keynesian unemployment
Cyclical or Keynesian unemployment, also known as demand deficient unemployment, occurs when there is not enough aggregate demand in the economy. It gets its name because it varies with the business cycle, though it can also be persistent, as during the Great Depression of the 1930s. This is caused by a business cycle recession, and wages not falling to meet the equilibrium level. Cyclical unemployment rises during economic downturns and falls when the economy improves. Keynesians argue that this type of unemployment exists due to inadequate effective aggregate demand. Demand for most goods and services falls, less production is needed and consequently fewer workers are needed, wages do not fall to meet the equilibrium level, and mass unemployment results.Some consider this type of unemployment one type of frictional unemployment in which factors causing the friction are partially caused by some cyclical variables. For example, a surprise decrease in the money supply may shock participants in society.
In this case, the number of unemployed workers exceeds the number of job vacancies, so that if even all open jobs were filled, some workers would remain unemployed. This kind of unemployment coincides with unused industrial capacity (unemployed capital goods). Keynesian economists see it as possibly being solved by government deficit spending or by expansionary monetary policy, which aims to increase non-governmental spending by lowering interest rates.
In contrast, Austrian economists argue that government spending and policies are the root cause of economic cycles and cyclical unemployment and should be reformed or removed.
Classical economics rejects the conception of cyclical unemployment, seeing the attainment of full employment of resources and potential output as the normal state of affairs.[citation needed]
tructural unemployment
| | The following text needs to be harmonized with text in Structural unemployment. |
Structural unemployment is hard to separate empirically from frictional unemployment, except to say that it lasts longer. As with frictional unemployment, simple demand-side stimulus will not work to easily abolish this type of unemployment.
Structural unemployment may also be encouraged to rise by persistent cyclical unemployment: if an economy suffers from long-lasting low aggregate demand, it means that many of the unemployed become disheartened, while their skills (including job-searching skills) become "rusty" and obsolete. Problems with debt may lead to homelessness and a fall into the vicious circle of poverty. This means that they may not fit the job vacancies that are created when the economy recovers. Some economists see this scenario as occurring under British Prime Minister Margaret Thatcher during the 1970s and 1980s. The implication is that sustained high demand may lower structural unemployment. This theory of persistence in structural unemployment has been referred to as an example of path dependence or "hysteresis."
Much technological unemployment (e.g. due to the replacement of workers by machines) might be counted as structural unemployment. Alternatively, technological unemployment might refer to the way in which steady increases in labor productivity mean that fewer workers are needed to produce the same level of output every year. The fact that aggregate demand can be raised to deal with this problem suggests that this problem is instead one of cyclical unemployment. As indicated by Okun's Law, the demand side must grow sufficiently quickly to absorb not only the growing labor force but also the workers made redundant by increased labor productivity. Otherwise, we see a jobless recovery such as those seen in the United States in both the early 1990s and the early 2000s.
Seasonal unemployment may be seen as a kind of structural unemployment, since it is a type of unemployment that is linked to certain kinds of jobs (construction work, migratory farm work). The most-cited official unemployment measures erase this kind of unemployment from the statistics using "seasonal adjustment" techniques.
Long-term unemployment
This is normally defined, for instance in European Union statistics, as unemployment lasting for longer than one year. It is an important indicator of social exclusion.Hidden unemployment
Hidden, or covered, unemployment is the unemployment of potential workers that is not reflected in official unemployment statistics, due to the way the statistics are collected. In many countries only those who have no work but are actively looking for work (and/or qualifying for social security benefits) are counted as unemployed. Those who have given up looking for work (and sometimes those who are on Government "retraining" programmes) are not officially counted among the unemployed, even though they are not employed. The same applies to those who have taken early retirement to avoid being laid off, but would prefer to be working. The statistic also does not count the "underemployed" - those with part time or seasonal jobs who would rather have full time jobs. Because of hidden unemployment, official statistics often underestimate unemployment rates.Full employment
Main article: Full employment
In demand based theory, it is possible to abolish cyclical unemployment by increasing the aggregate demand for products and workers. However, eventually the economy hits an "inflation barrier" imposed by the four other kinds of unemployment to the extent that they exist.Some demand theory economists see the inflation barrier as corresponding to the natural rate of unemployment. The "natural" rate of unemployment is defined as the rate of unemployment that exists when the labor market is in equilibrium and there is pressure for neither rising inflation rates nor falling inflation rates. More scientifically, this rate is sometimes referred to as the NAIRU or the Non-Accelerating Inflation Rate of Unemployment
No matter what its name, demand theory holds that this means that if the unemployment rate gets "too low," inflation will get worse and worse (accelerate) in the absence of wage and price controls (incomes policies). Others simply see the possibility of inflation rising as the unemployment rate falls. This is the discredited Phillips curve.
One of the major problems with the NAIRU theory is that no-one knows exactly what the NAIRU is (while it clearly changes over time). The margin of error can be quite high relative to the actual unemployment rate, making it hard to use the NAIRU in policy-making.
Another, normative, definition of full employment might be called the ideal unemployment rate. It would exclude all types of unemployment that represent forms of inefficiency. This type of "full employment" unemployment would correspond to only frictional unemployment (excluding that part encouraging the McJobs management strategy) and would thus be very low. However, it would be impossible to attain this full-employment target using only demand-side Keynesian stimulus without getting below the NAIRU and suffering from accelerating inflation (absent incomes policies). Training programs aimed at fighting structural unemployment would help here.
To the extent that hidden unemployment exists, it implies that official unemployment statistics provide a poor guide to what unemployment rate coincides with "full employment".
Costs of unemployment
Individual

Dr. M. Brenner conducted a study in 1979 on the "Influence of the Social Environment on Psychology." Brenner found that for every 10% increase in the number of unemployed there is an increase of 1.2% in total mortality, a 1.7% increase in cardiovascular disease, 1.3% more cirrhosis cases, 1.7% more suicides, 4.0% more arrests, and 0.8% more assaults reported to the police.[13] A more recent study by Christopher Ruhm[14] on the effect of recessions on health found that several measures of health actually improve during recessions. As for the impact of an economic downturn on crime, during the Great Depression the crime rate did not decrease. Because unemployment insurance in the U.S. typically does not replace 50% of the income one received on the job (and one cannot receive it forever), the unemployed often end up tapping welfare programs such as Food Stamps or accumulating debt. Higher government transfer payments in the form of welfare and food stamps decrease spending on productive economic goods, decreasing GDP.[citation needed]
Some hold that many of the low-income jobs are not really a better option than unemployment with a welfare state (with its unemployment insurance benefits). But since it is difficult or impossible to get unemployment insurance benefits without having worked in the past, these jobs and unemployment are more complementary than they are substitutes. (These jobs are often held short-term, either by students or by those trying to gain experience; turnover in most low-paying jobs is high) Unemployment insurance keeps an available supply of workers for the low-paying jobs, while the employers' choice of management techniques (low wages and benefits, few chances for advancement) is made with the existence of unemployment insurance in mind. This combination promotes the existence of one kind of unemployment, frictional unemployment.[citation needed]
Another cost for the unemployed is that the combination of unemployment, lack of financial resources, and social responsibilities may push unemployed workers to take jobs that do not fit their skills or allow them to use their talents. Unemployment can cause underemployment, and fear of job loss can spur psychological anxiety.
Social
An economy with high unemployment is not using all of the resources, e.g. labour, available to it. Since it is operating below its production possibility frontier, it could have higher output if all the workforce were usefully employed. However, there is a trade off between economic efficiency and unemployment: if the frictionally unemployed accepted the first job they were offered, they would be likely to be operating at below their skill level, reducing the economy's efficiency.[15]It is estimated that, during the Great Depression, unemployment due to sticky wages cost the US economy about $4 trillion.[citation needed] This is many times larger than losses due to monopolies, cartels and tariffs.[citation needed]
During a long period of unemployment, workers can lose their skills, causing a loss of human capital. Being unemployed can also reduce the life expectancy of workers by about 7 years [16]
High unemployment can encourage xenophobia and protectionism as workers fear that foreigners are stealing their jobs.[citation needed] Efforts to preserve existing jobs of domestic and native workers include legal barriers against "outsiders" who want jobs, obstacles to immigration, and/or tariffs and similar trade barriers against foreign competitors.
Finally, a rising unemployment rate concentrates the oligopsony power of employers by increasing competition amongst workers for scarce employment opportunities.[citation needed].
Socio-political
High levels of unemployment can be causes of civil unrest, in some cases leading to revolution, and particularly totalitarianism. The fall of the Weimar Republic in 1933 and Adolf Hitler's rise to power, which culminated in World War II and the deaths of tens of millions and the destruction of much of the physical capital of Europe is attributed to the poor economic conditions in Germany at the time, notably a high unemployment rate[5] of above 20%; see Great Depression in Central Europe for details.Note that the hyperinflation in the Weimar republic is not directly blamed for the Nazi rise – the Inflation in the Weimar Republic occurred primarily in the period 1921–23, which was contemporary with Hitler's Beer Hall Putsch of 1923, and is blamed for damaging the credibility of democratic institutions, but the Nazi party only assumed government in 1933, 10 years after the hyperinflation but in the midst of high unemployment.
Historical and contemporary unemployment
In the 16th century in England, no distinction was made between vagrants and the jobless; both were simply categorised as "sturdy beggars", to be punished and moved on.[17] The closing of the monasteries in the 1530s increased poverty as the church had helped the poor. In addition, there was a significant rise in enclosure during the Tudor period. Also the population was rising. Those unable to find work had a stark choice: starve or break the law. In 1535, a bill was drawn up calling for the creation of a system of public works to deal with the problem of unemployment, to be funded by a tax on income and capital. A law passed a year later allowed vagabonds to be whipped and hanged.[18] In 1547, a bill was passed that subjected vagrants to some of the more extreme provisions of the criminal law, namely two years servitude and branding with a "V" as the penalty for the first offence and death for the second.[19] During the reign of Henry VIII, as many as 72,000 people are estimated to have been executed.[20]In the 1576 Act each town was required to provide work for the unemployed.[21] The Elizabethan Poor Law of 1601, one of the world's first government-sponsored welfare programs, made a clear distinction between those who were unable to work and those able-bodied people who refused employment.[22] Under the Poor Law systems of England and Wales, Scotland and Ireland a workhouse was a place where people who were unable to support themselves, could go to live and work.[23] In the early 1700s, there were roughly 10 million people living in England, and an estimated two million were, “vagrants, rogues, prostitutes, beggars or indigents.”[24] In 18th century England, half the population was at least occasionally dependent on charity for subsistence.[25] By 1776 some 1,912 parish and corporation workhouses had been established in England and Wales, housing almost 100,000 paupers.
The decade of the 1930s saw the Great Depression in the United States and many other countries. In 1929, the U.S. unemployment rate averaged 3%.[26] In 1933, 25% of all American workers and 37% of all nonfarm workers were unemployed,[27] with firms unwilling to employ workers at the abnormally high wage rates enforced while output fell.[28] In Cleveland, Ohio, the unemployment rate was 60%; in Toledo, Ohio, 80%.[29] Unemployment in Canada reached 27% at the depth of the Depression in 1933.[30] In some towns and cities in the north east of England, unemployment reached as high as 70%. In Germany the unemployment rate reached nearly 25% in 1932.[31] One Soviet trading corporation in New York averaged 350 applications a day from Americans seeking jobs in the Soviet Union.[32] There were two million homeless people migrating across the United States. One Arkansas man walked 900 miles looking for work.[29]
About 25 million people in the world's 30 richest countries will have lost their jobs between the end of 2007 and the end of 2010 as the economic downturn pushes most countries into recession.[33] In October 2009, the U.S. unemployment rate was 10.2%.[34] The youth unemployment rate was 18.5% in July 2009, the highest July rate since 1948.[35] 34.5% of young African American men were unemployed in October 2009.[36] Officially, Detroit’s unemployment rate is 27%, but Detroit News suggests that nearly half of this city’s working-age population may be unemployed.[37]
The official unemployment rate in the 16 EU countries that use the euro rose to 10% in December 2009.[38] Latvia has the highest unemployment rate in EU at 22.3% for November 2009.[39] Europe's young workers have been especially hard hit.[40] In November 2009, the unemployment rate in the EU27 for those aged 15–24 was 18.3%. For those under 25, the unemployment rate in Spain was 43.8%.[41]
http://en.wikipedia.org/wiki/Unemployment
 | Urbanization and Global Change |
| 01/04/2006 |
Global Urban Population in Developed and Developing Countries
The human population has lived a rural lifestyle through most of history. The world’s population, however, is quickly becoming urbanized as people migrate to the cities. Figure 1 shows the urban population growth between 1950 and the year 2000. In 1950, less than 30% of the world’s population lived in cities. This number grew to 47% in the year 2000 (2.8 billion people), and it is expected to grow to 60% by the year 2025.
The human population has lived a rural lifestyle through most of history. The world’s population, however, is quickly becoming urbanized as people migrate to the cities. Figure 1 shows the urban population growth between 1950 and the year 2000. In 1950, less than 30% of the world’s population lived in cities. This number grew to 47% in the year 2000 (2.8 billion people), and it is expected to grow to 60% by the year 2025.
 |
| Figure 1 |
| Global urban population in developed and developing countries | Global rural population in developed and developing countries |
 |  |
| Figure 2: Future projections, 1994-2025 (population in thousands) | |
Cities with over 5 million inhabitants are known as megacities. There were 41 in the year 2000. This number is expected to grow as the population increases in the next few decades. It is predicted that by the year 2015, 50 megacities will exist, and 23 of these are expected to have over 10 million people. Table I is a list of the world’s 25 largest cities in 1995.
| The World's 25 Largest Cities, 1995 | |
| | Population (Millions) |
| Tokyo, Japan | 26.8 |
| Sao Paulo, Brazil | 16.4 |
| New York, USA | 16.3 |
| Mexico City, Mexico | 15.6 |
| Bombay, India | 15.1 |
| Shanghai, China | 15.1 |
| Los Angeles, USA | 12.4 |
| Beijing, China | 12.4 |
| Calcutta, India | 11.7 |
| Seoul, South Korea | 11.6 |
| Jakarta, Indonesia | 11.5 |
| Buenos Aires, Argentina | 11.0 |
| Tianjin, China | 10.7 |
| Osaka, Japan | 10.6 |
| Lagos, Nigeria | 10.3 |
| Rio de Janeiro, Brazil | 9.9 |
| Delhi, India | 9.9 |
| Karachi, Pakistan | 9.9 |
| Cairo, Egypt | 9.7 |
| Paris, France | 9.5 |
| Metropolitan Manila, Philippines | 9.3 |
| Moscow, Russia | 9.2 |
| Dhaka, Bangladesh | 7.8 |
| Istanbul, Turkey | 7.8 |
| Lima, Peru | 7.2 |
| Table I, Source: United Nations, Population Division. World Urbanization Prospects. 1994 | |
Why is the urban population increasing so fast?
The rapid growth of urban areas is the result of two factors: natural increase in population (excess of births over deaths), and migration to urban areas. Natural population growth has been covered in other units, and consequently, here we will concentrate on migration.
Migration is defined as the long-term relocation of an individual, household or group to a new location outside the community of origin. Today the movement of people from rural to urban areas (internal migration) is most significant. Although smaller than the movement of people within borders, international migration is also increasing. Figure 3 shows the annual net international migration totals and migration rates in the world’s major areas between 1990 and 1995. Both internal and international migration contribute to urbanization.
 |
| Figure 3: Annual net international migration totals and migration rates in the world's major areas, 1990-1995 |
Migration is often explained in terms of either “push factors” – conditions in the place of origin which are perceived by migrants as detrimental to their well-being or economic security, and “pull factors” – the circumstances in new places that attract individuals to move there. Examples of push factors include high unemployment and political persecution; examples of pull factors include job opportunities or moving to a better climate.
Typically, a pull factor initiates migration that can be sustained by push and other factors that facilitate or make possible the change. For example, a farmer in rural Mexico whose land has become unproductive because of drought (push factor) may decide to move to Mexico City where he perceives more job opportunities and possibilities for a better lifestyle (pull factor). In general, cities are perceived as places where one could have a better life, because of better opportunities, higher salaries, better services, and better lifestyles. The perceived better conditions attract poor people from rural areas.
In order to better illustrate the causes of rural migration, we will consider policies that have led to migration in many developing countries. In order to pay foreign debt and to be more competitive in international markets, national governments have encouraged the export of national resources and agricultural products. Agricultural products (sugar, flowers, coffee, etc.), and primary-sector goods (timber, fish, minerals, etc) become natural resource capital that can be traded to bolster the national economy. In order to produce agricultural products quickly, efficiently, and for a decent prize, national governments often look to decrease the number of small producers, and turn agricultural production and resource extraction over to larger enterprises, with larger production facilities, and a lower per-unit cost of production. This trend turns land into a commodity, that can be bought and sold, and it is viewed only in terms of its productive capabilities. Free market economics pursues economic efficiency to deliver goods at the lowest possible price, and its advocates maintain that any government intervention diminishes this efficiency. Consequently, they seek to eliminate farm programs such as farm subsidies, cheap credit policies, etc. intended to help the farmer, and to maintain stable prices. This scenario leaves farmers to shoulder the burden of farming, sometimes with no alternative but to sell their land to a foreign investor or a domestic-owned enterprise, and move to the cities, where the farmer hopes to have a better life.
Other policies reinforce the above scenario. In this case, in order to boost the production of cheaper goods, governments have maintained artificially low food prices in urban areas. The strategy here is to maintain urban food prices below market levels to reduce the cost of urban labor and urban life. This policy has resulted in inadequate compensation of rural producers for the costs they incur to produce food products and thus have aggravated rural poverty. On the other hand, these policies have also made city life more attractive and pulled them from rural areas. As a result of these policies, an average of 270,000 rural migrants have been arriving in Mexico City annually over the last ten years, transforming it into one of the largest cities in the world.
International migration includes labor migration, refugees and undocumented migrants. Similar to rural-to-urban migration, individuals move in search of jobs and a better life. Income disparities among regions, and job opportunities, are key motivating factors. The migration policies of sending and receiving countries also play a key role. The best current estimate from the United Nations Population Fund, indicates that more than 100 million people were living outside their countries of birth or citizenship in 1998. There is a number of reasons why this figure is rising, but an important one is that the native labor pool in the industrialized countries is shrinking, while the developing world’s workforce is rapidly increasing. Figure 4 shows the countries with largest stock of migrants in their population, while figure 5 shows the countries whose populations have the largest percentage of migrants. Today, international migration is at an all-time high. About 2% of the Earth’s population has moved away from the country of origin.
 |
| Figure 4: Countries with the largest international migrant stock, 1990 (thousands) |
 |
| Figure 5: Countries with the highest percentage of international migrants in total population, 1990 (percent) |
| History of U.S. Migration
|
International refugees contribute to the urban migrant population. The United Nations High Commission for Refugees (UNHCR) reports that most of the 22 million people who came under its wing in 1997 were fleeing from domestic or international conflict. Figure 5 shows the number of refugees registered by the United Nations between 1960 and 1997. The Geneva Convention (1951) on Refugees defines refugees as those individuals who migrate because of:“….well founded fear of being persecuted for reasons of race, religion, nationality, membership of a particular group, or political opinion”.
Nations honoring the Geneva Convention have an obligation to determine whether, in fact, individuals will truly face persecution at home. Excluded are those who fear famine or are pushed out by natural disasters. The overwhelming majority of refugees come from developing nations, and most of them flee to poor countries.
 |
| Figure 6 |
The urbanization process refers to much more than simple population growth; it involves changes in the economic, social and political structures of a region. Rapid urban growth is responsible for many environmental and social changes in the urban environment and its effects are strongly related to global change issues. The rapid growth of cities strains their capacity to provide services such as energy, education, health care, transportation, sanitation and physical security. Because governments have less revenue to spend on the basic upkeep of cities and the provision of services, cities have become areas of massive sprawl, serious environmental problems, and widespread poverty.
During the 19th and early 20th centuries, urbanization resulted from and contributed to industrialization. New job opportunities in the cities motivated the mass movement of surplus population away from the countryside. At the same time, migrants provided cheap, plentiful labor for the emerging factories. Today, due to movements such as globalization, the circumstances are similar in developing countries. Here the concentration of investments in cities attracts large numbers of migrants looking for employment, thereby creating a large surplus labor force, which keeps wages low. This situation is attractive to foreign investment companies from developed countries who can produce goods for far less than if the goods were produced where wages are higher. Thus, one might wonder if urban poverty serves a distinct function for the benefit of global capital.
One of the major effects of rapid urban growth is “urban sprawl"- scattered development that increases traffic, saps local resources and destroys open space. Urban sprawl is responsible for changes in the physical environment, and in the form and spatial organization of cities.
Developed and less developed countries of the world differ not only in the percent living in cities, but also in the way in which urbanization is occurring. In Mexico City (950 square miles), as in many other megacities in the developing world, urban sprawl exists as nearly 40% of city dwellers live in the urban periphery in poverty and environmental degradation. These high density settlements are often highly polluted owing to the lack of urban services, including running water, trash pickup, electricity or paved roads. Nevertheless, cities provide poor people with more opportunities and greater access to resources to transform their situation than rural areas
In the United States, poorly planned urban development is threatening our environment, our health, and our quality of life. In communities across the United States, sprawl is taking a serious toll.
Consequences of sprawl in the United States
- Increases traffic
- Pollutes air and water.
- Worsens the damage from floods.
- Destroys agricultural land, parks, and open space.
- Costs cities and counties millions of dollars for new water and sewer lines, new schools, and increased police and fire protection.
- Creates crowded schools in the suburbs and empty, crumbling schools in center cities.
Solutions to decrease sprawl
- Enacting growth boundaries, parks and open space protection
- Planning for and directing transportation dollars to promote public transportatio.
- Reversing government programs and tax policies that help create sprawl.
- Revitilizing already developed areas through measures such as attracting new businesses, reducing crime and improving schools;
- Preventing new development in floodplains, coastal areas and other disaster- prone areas.